Feb. 8, 2012 Press Release Biology Chemistry
New study sheds light on genetics of rice metabolism
A large-scale study analyzing metabolic compounds in rice grains conducted by researchers at the RIKEN Plant Science Center (PSC) and their collaborators has identified 131 rice metabolites and clarified the genetic and environmental factors that influence their production. The findings provide a natural way to bioengineer improved rice grain varieties by selectively increasing production of useful metabolites, boosting the nutritional value of crops.
As one of the most important staple crops, rice plays a central role in supplying the nutrients needed to keep the world population healthy. The nutritional value of rice crops is determined by the types and quantities of metabolites they contain, which are strongly affected by environmental and genetic factors. Understanding these factors is crucial to increasing nutritional value, but the complex relationship between genes and plant metabolism makes this a formidable challenge.
At the heart of this challenge are so-called quantitative train loci (QTL), stretches of DNA which contain or link to the genes for a phenotypic trait, in this case metabolite levels. To breed lines of rice which produce more of a specific metabolite (for example one that boosts its nutritional value), you have to know which DNA regions are involved and in what role. This is hard because metabolite levels are controlled by many different QTLs and also strongly influenced by the environment.
To solve this problem, researchers at the PSC teamed up with their collaborators at the National Institute of Agrobiological Science (NIAS) to analyze rice grain metabolomic QTL (mQTL) using state-of-the-art mass spectroscopy pipelines developed at the PSC. Analysis of 85 experimental lines of rice specially bred for QTL analysis, prepared by the NIAS researchers and harvested in 2005 and 2007, yielded a total of 759 metabolite signals. From these, the team identified 131 metabolites, including amino acids, lipids, and flavonoids, and identified a total of 801 mQTLs around the rice genome.
Most important of all, the team showed that while the levels of most metabolites they identified are influenced mainly by environmental factors, genetics can sometimes play a stronger role: coordinated control of amino acids was linked to an mQTL "hotspot" on chromosome 3, while variation of flavenoid levels was linked to genetic factors. Published in The Plant Journal, the findings promise a future of faster, more effective breeding techniques for rice, and mark a major step toward a healthier, better-fed world.
Reference
- Fumio Matsuda, Yozo Okazaki, Akira Oikawa, Miyako Kusano, Ryo Nakabayashi, Jun Kikuchi, Jun-ichi Yonemaru, Kaworu Ebana, Masahiro Yano and Kazuki Saito. “Dissection of genotype-phenotype associations in rice grains using metabolome quantitative trait loci analysis”. The Plant Journal, 2012, DOI: 10.1111/j.1365-313X.2012.04903.x
Contact
Kazuki Saito
Metabolomic Function Research Group
RIKEN Plant Science Center
Tel: +81-(0)45-503-9488 / Fax: +81-(0)45-503-9489
Fumio Matsuda
Metabolomic Function Research Group
RIKEN Plant Science Center
Tel: +81-(0)45-503-9442 / Fax: +81-(0)45-503-9489
Yokohama Planning Section
RIKEN Yokohama Research Promotion Division
Tel: +81-(0)45-503-9117 / Fax: +81-(0)45-503-9113
Jens Wilkinson
RIKEN Global Relations and Research Coordination Office
Tel: +81-(0)48-462-1225 / Fax: +81-(0)48-463-3687
Email: pr[at]riken.jp
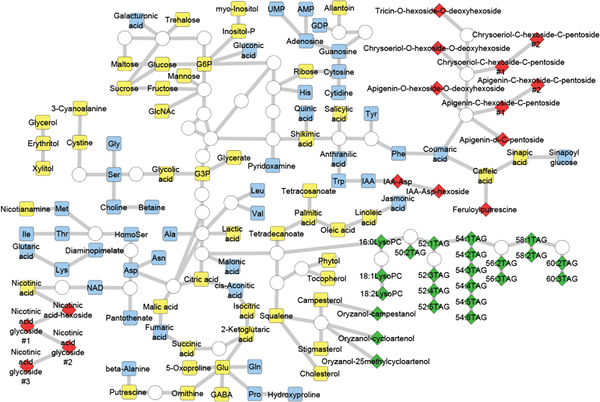
Figure 1: Rice grain metabolites annotated in this study
Rice grain metabolites are represented in the simplified metabolic pathway. Node colour represent the method used for analysis of that metabolite: gas chromatography-time-of-flight-mass spectrometry (GC-TOF-MS, yellow), capillary electro-phoresis-time-of-flight-mass spectrometry (CE-TOF-MS, blue), liquid chromatography-ion trap-time-of-flight-mass spectrometry (LC-IT-TOF-MS, green) and liquid chromatography-quadrupole-time-of-flight-mass spectrometry (LC-Q-TOF-MS, red). Node shape represents the reliability of metabolite annotation: rectangles indicate metabolites whose structure was identified by comparing their chromatographic behavior and mass spectra with standard compounds, whereas diamonds indicate metabolites whose structure was determined by MS and MS/MS spectral data.
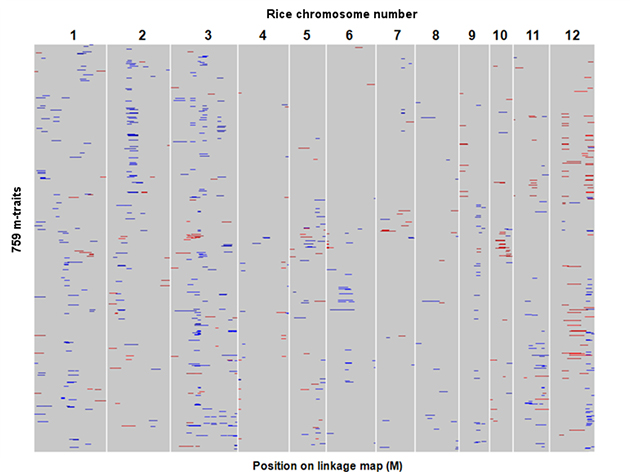
Figure 2: Genome-wide distribution of quantitative trait loci (QTLs) controlling metabolite levels in rice grains.
Each row represents QTL mapping of single metabolic traits (m-traits). The results for a total of 758 m-traits are shown. Regions indicated in red or blue represent log-of-odds (LOD) intervals of detected mQTLs that positively affect the m-traits of Sasanishiki (red) and Habataki (blue) genotypes.