Jun. 27, 2008 Research Highlight Biology
Waiting for the light to change
A new technique installs fluorescent ‘traffic lights’ in living cells, enabling researchers to tell whether or not they are actively dividing
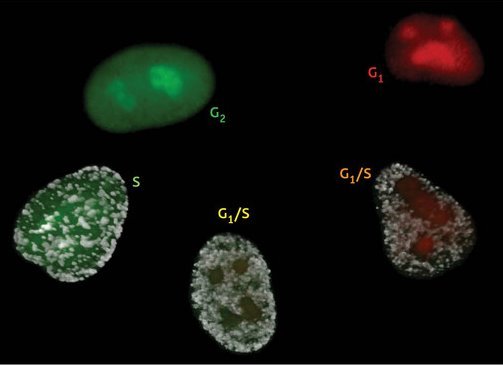 Figure 1: The Fucci cell cycle visualization method. Cells in phase G1 fluoresce bright red. As they transition into the S phase and begin DNA replication, Cdt1 levels are dramatically reduced while Geminin levels increase. This results in faint yellow fluorescence early in G1/S that soon gives way to robust green fluorescence, which lasts until the cell re-enters G1 phase.
Cells live their days on the fixed schedule of the cell cycle, which regulates when—and if—they divide. Some cells cycle rapidly and, as a result, divide actively. For others, the cell cycle is stalled; these will not divide, but may instead differentiate into mature cells that no longer reproduce.
Understanding cell cycle behavior of individual cells in complex tissues would be valuable in studying processes like embryonic development and tumor formation, but this has proven difficult. Existing techniques for visually monitoring cell cycle state generally require either the use of chemical stains that act as indicators of DNA replication, or direct tinkering with cellular behavior through the use of specialized pharmacological agents. These methods have proven useful for basic cell cycle studies, but more sensitive and precise indicators will be required for scientists hoping to identify and characterize patterns of cell cycle behavior in complex tissues.
“Considerable progress has been made towards understanding the mechanism of cell cycle progression in single cells,” explains Atsushi Miyawaki of the RIKEN Brain Science Institute in Wako. “However, little is known about how the cell cycle is coordinated with differentiation, morphogenesis, and cell death in a multicellular context.”
To ensure tight regulation of cell division, cells use a variety of strategies to maintain close control over levels of proteins involved in the cell cycle. For example, the proteins Cdt1 and Geminin regulate chromosomal DNA replication during the ‘S’ phase of the cell cycle. These molecules have opposing effects on DNA replication, and their levels fluctuate accordingly throughout the cell cycle—Cdt1 levels are highest in the ‘G1’ phase, directly before DNA replication, but as cells transition into S phase, Cdt1 levels fall and Geminin levels rise, remaining high until the cell returns to G1. Rather than regulating this process by modulating gene activity, cells exert their control over Cdt1 and Geminin at the protein level, using a process called ‘ubiquitination’ that precisely targets unwanted proteins for destruction.
Fucci labels light up the cell cycle
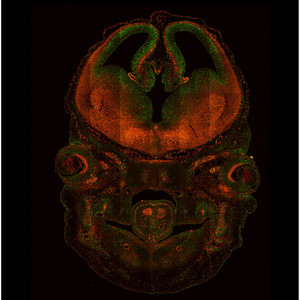 Figure 2: Sectional image of the head from a Fucci-expressing transgenic mouse embryo, illustrating how cell growth in the developing brain is controlled with cell differentiation. Cell growth and differentiation are indicated by green and red signals, respectively.
Miyawaki and colleague Asako Sakaue-Sawano took advantage of this carefully regulated process to develop a surprisingly precise visual indicator of cell cycle status in living cells, a technique they call Fucci1. In Fucci, which is short for ‘fluorescent ubiquitination-based cell cycle indicator’, cells are genetically modified to express Cdt1 and Geminin with red and green fluorescent tags, respectively. As a result, the nuclei of cells in S and G2 phases glow green, indicating active division. Cells that are in G1, on the other hand, will glow red—this can indicate a temporary cessation of division, or permanent cell cycle arrest due to terminal differentiation. Due to the timing of the red-to-green conversion in the nucleus, cells re-entering active division will glow yellow as their DNA begins to replicate, providing an additional color indicator for cell cycle activity (Fig. 1).
As an initial test of their system, the team examined changes in the cell cycle profile of Fucci-expressing epithelial cells in a simulated wound-healing scenario. The cells initially exhibited green fluorescence as they divided to spread across the glass surface on which they were cultured, but began to turn red as they approached a critical level of crowding, indicating that cell division was being arrested. However, the introduction of a lesion in this cell monolayer led to the appearance of a burst of green fluorescence at the edges of the wound as the cells began dividing anew to initiate healing.
Applications beyond the cell cycle
Miyawaki and colleagues subsequently demonstrated that their method is suitable for intravital imaging studies, in which cellular processes are directly observed within a living animal. In a first round of experiments, cancer cells expressing Fucci were injected into nude mice, enabling the researchers to monitor changes in the cell cycle profiles of the foreign cells as they replicated and began to spread metastatically. Based on these findings, the team has already begun applying Fucci as a means for examining candidate anticancer drugs and their impact on tumor cell division and migration.
Fucci also offers a powerful means for studying embryonic development. Miyawaki and colleagues generated genetically modified mice that express the Fucci proteins in every cell, and used these to characterize the cell-cycle behavior of neural progenitor cells within the developing rodent brain (Fig. 2). The fluorescent proteins were sufficiently bright for the investigators to collect time-lapse image series, enabling them to assemble detailed profiles of the division, migration and differentiation behavior of large numbers of cells at once. Miyawaki believes that future studies could combine the Fucci system with other fluorescent labels specific for various cytoplasmic proteins, making it possible to perform more exclusive cell cycle analyses of specific cell subtypes.
Indeed, one of the greatest strengths of Fucci lies in its flexibility, and since their initial publication Miyawaki’s team has made considerable progress in building on their technique. These advances include expanding the range of colors available for use in Fucci, thereby extending the technique’s compatibility with other fluorescent indicators, and developing Fucci constructs that operate effectively in zebrafish—another popular model for studying vertebrate development. Their work has also been assisted by parallel efforts at developing new software tools for image analysis. “We have developed special software that will facilitate cell cycle analyses using Fucci,” says Miyawaki, “as well as some programs that allow us to track cell lineage very efficiently.”
References
- 1. Sakaue-Sawano, A., Kurokawa, H., Morimura, T., Hanyu, A., Hama, H., Osawa, H. Kashiwagi, S., Fukami, K., Miyata, T., Miyosi, H. et al. Visualizing spatiotemporal dynamics of multicellular cell-cycle progression. Cell 132, 487–498 (2008). doi: 10.1016/j.cell.2007.12.033
About the Researcher
Atsushi Miyawaki

Atsushi Miyawaki was born in Gifu, Japan, in 1961. He received his M.D. in medicine at Keio University School of Medicine in 1987 and his Ph.D. in signal transduction at Osaka University School of Medicine in 1991. He served as a researcher and then an assistant professor in the Institute of Medical Science, the University of Tokyo from 1991 to 1998. His main research was focused on calcium signaling. He also joined Department of Pharmacology, the University of California, San Diego as an HFSP long-term fellowship and a research pharmacologist from 1995 to 1998, to work on technological innovations in fluorescence imaging. In 1999, after returning to Japan, he set out a laboratory, Laboratory for Cell Function Dynamics at Brain Science Institute (BSI) of RIKEN. From 2004 he has been directing Advanced Technology Development Group of BSI. He has been also directing BSI as a vice director since this year. His primary research goal is to better understand how biological functions are controlled in space and time.