Sep. 1, 2013
Fucci: a probe to visualize dynamics of cell-cycle progression
RIKEN No.: 07219
Inventors
Atsushi Miyawaki, Asako Sakaue-Sawano (RIKEN),
Hisao Masai (Tokyo Metropolitan Institute of Medical Science)
Background
The cell-cycle is an “engine” that regulates events in vivo. Much effort has been made to elucidate the mechanisms controlling this “engine”. However, it is difficult to monitor the dynamics of cell-cycle progression in each cell or in a multicellular context in an organism by microscopic “in vivo analysis”. In particular, a technology that allows for real-time and high-sensitive observation of cell-cycle progression was not available before.
Summary
Visualization of G1/G0 and S/G2/M phases using fluorescent proteins of different colors.
Applicable to drug-screening experiments

We developed a fluorescent, ubiquitination-based cell-cycle indicator (Fucci), using an ubiquitin-mediated proteolysis mechanism and fluorescent proteins.
Fucci takes advantage of cell-cycle dependent change in the expression pattern of Geminin and Cdt1, direct substrates of APCcdh1 complex and SCFskp2 complex, respectively. By binding fragments of Geminin and Cdt1 to fluorescent proteins of different colors, the G1 and S/G2/M phases can be observed real-time with high sensitivity. Fucci has no effect on cell-cycle progression. This feature enables Fucci to be introduced not only in cultured cells but also in individual animals such as mice.
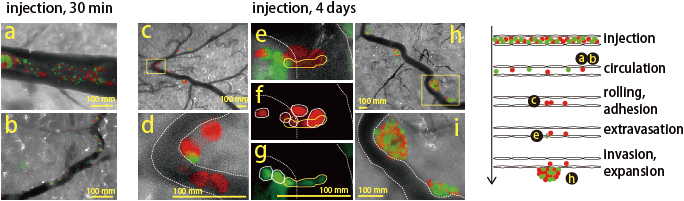
Fig.1 Visualization of the classic metastatic processes: adhesion and extravasation
Observation of Fucci-expressing cultured cells subcutaneously inoculated into the mammary fat pad of nude mice.

Fig.2 3D view of Fucci TG mice embryo
Tg(FucciS/G2/M)#504Bsi/Tg(FucciG1)#596Bsi mice can be used to visualize the cell cycle state in vivo. An E11.5 or an E13.5 Fucci whole embryo were treated with Scale U2 solution.
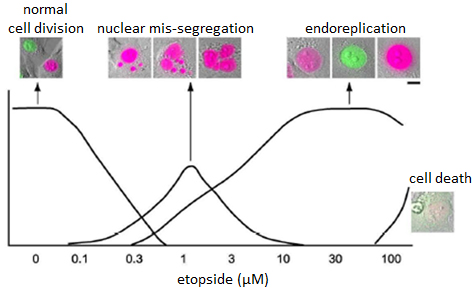
Fig.3 Responses of NMuMG/Fucci2 cells to etoposide.
Cell cycle alterations (G2 arrest, nuclear mis-segregation and endoreplication) observed in NMuMG cells treated with different concentrations of etoposide.
Merits
- Visualize G1/G0 and S/G2/M phases with different fluorescent proteins in living cells and animals
- Visualize responses of cancer cells to various anti-cancer drugs.
Applications
- Drug-screening
- Verification of cell cycle states of ES cells or stem cells.
- Application to visualization between the cell cycle states and tissue specific differentiations.
References
- 1.PCT/JP2008/051973
- 2.Sakaue-Sawano A et al.: Cell, 132: 487-498, 2008
- 3.Sakaue-Sawano A et al.: Chem. Biol., 15: 1243-1248, 2008
- 4.Sakaue-Sawano A et al.: BMC Cell Biol., 12:2, 2011
- 5.Hama H et al.: Nat. Neuroscience, 14: 1481-1488, 2011